Where do the points come from?
This week’s look at the Last Ten Champs is a little bit of a sequel to the entry a few weeks ago about how much teams rely on three-pointers. Here we’re going to look at the points distribution for each level. In other words, what percentage of their points come from two-pointers, three-pointers and free throws.
Just to be clear, none of the percentages here represent the percentage of shots made – this is just the percentage of total points that come from each of those areas.
Because there’s no one way that’s better than another, the presentation in this case is just in list form rather than ranked in any manner. Overall, on both the men’s and women’s side, the majority of points come from two-pointers
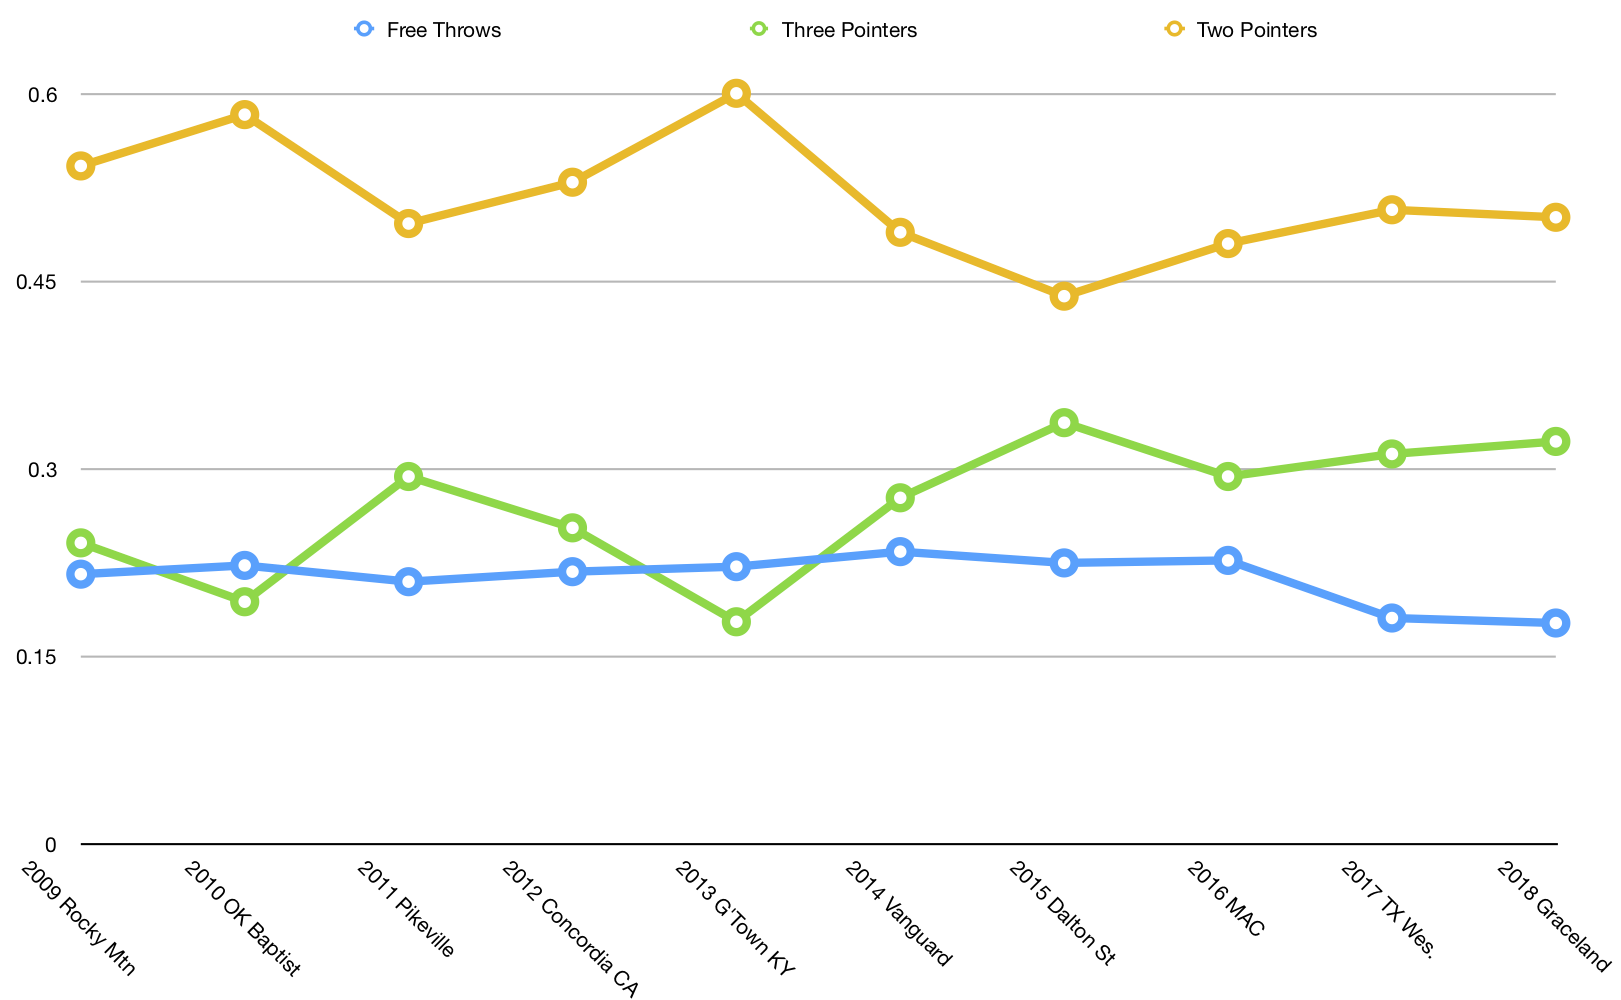
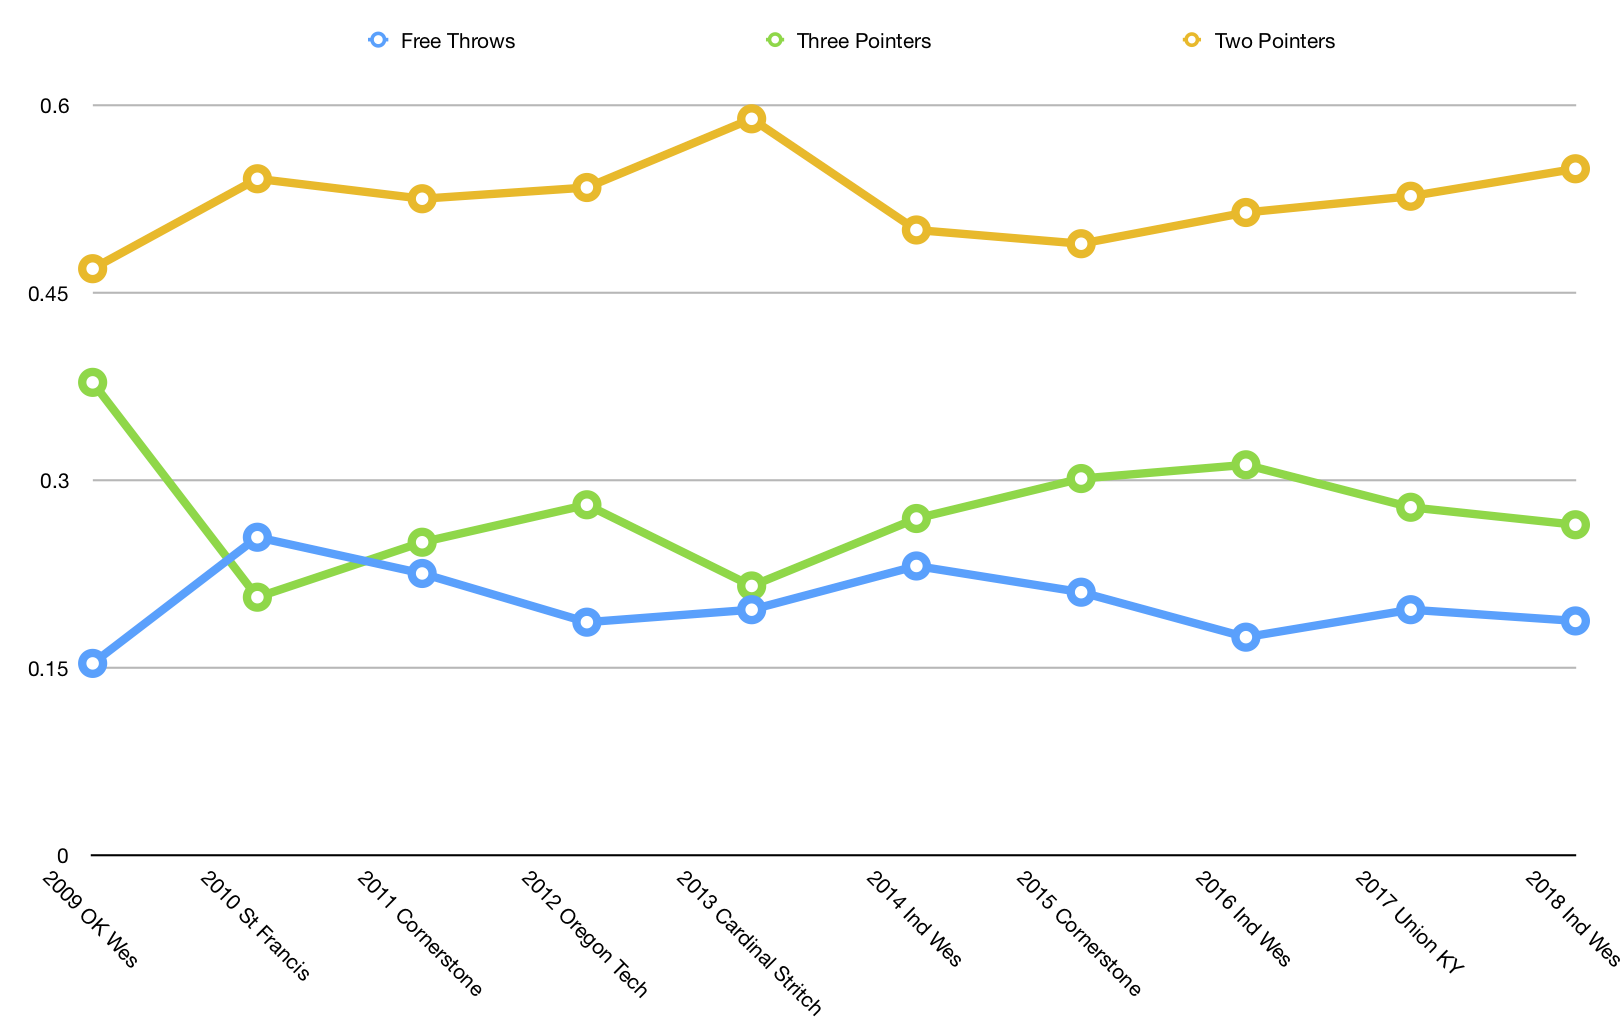
On the men’s side, you can see the NCAA D3 level gets more of its points from two-pointers than any other level by a couple of percentage points. NCAA D2 gets slightly more of its points from three-pointers. Meanwhile, NAIA D1 leads with 21.3% of their points from the free throw line.
(Click to enlarge)
The interesting thing here is the trend line. As you might imagine, the reliance on the three-pointer is up but the area suffering as a result, at all levels is the free throw line. You can see the gap between three-pointers and free throws increase in recent years. And this stands to reason because if you’re taking more shots from the perimeter, you’re not attacking as much and getting to the foul line.
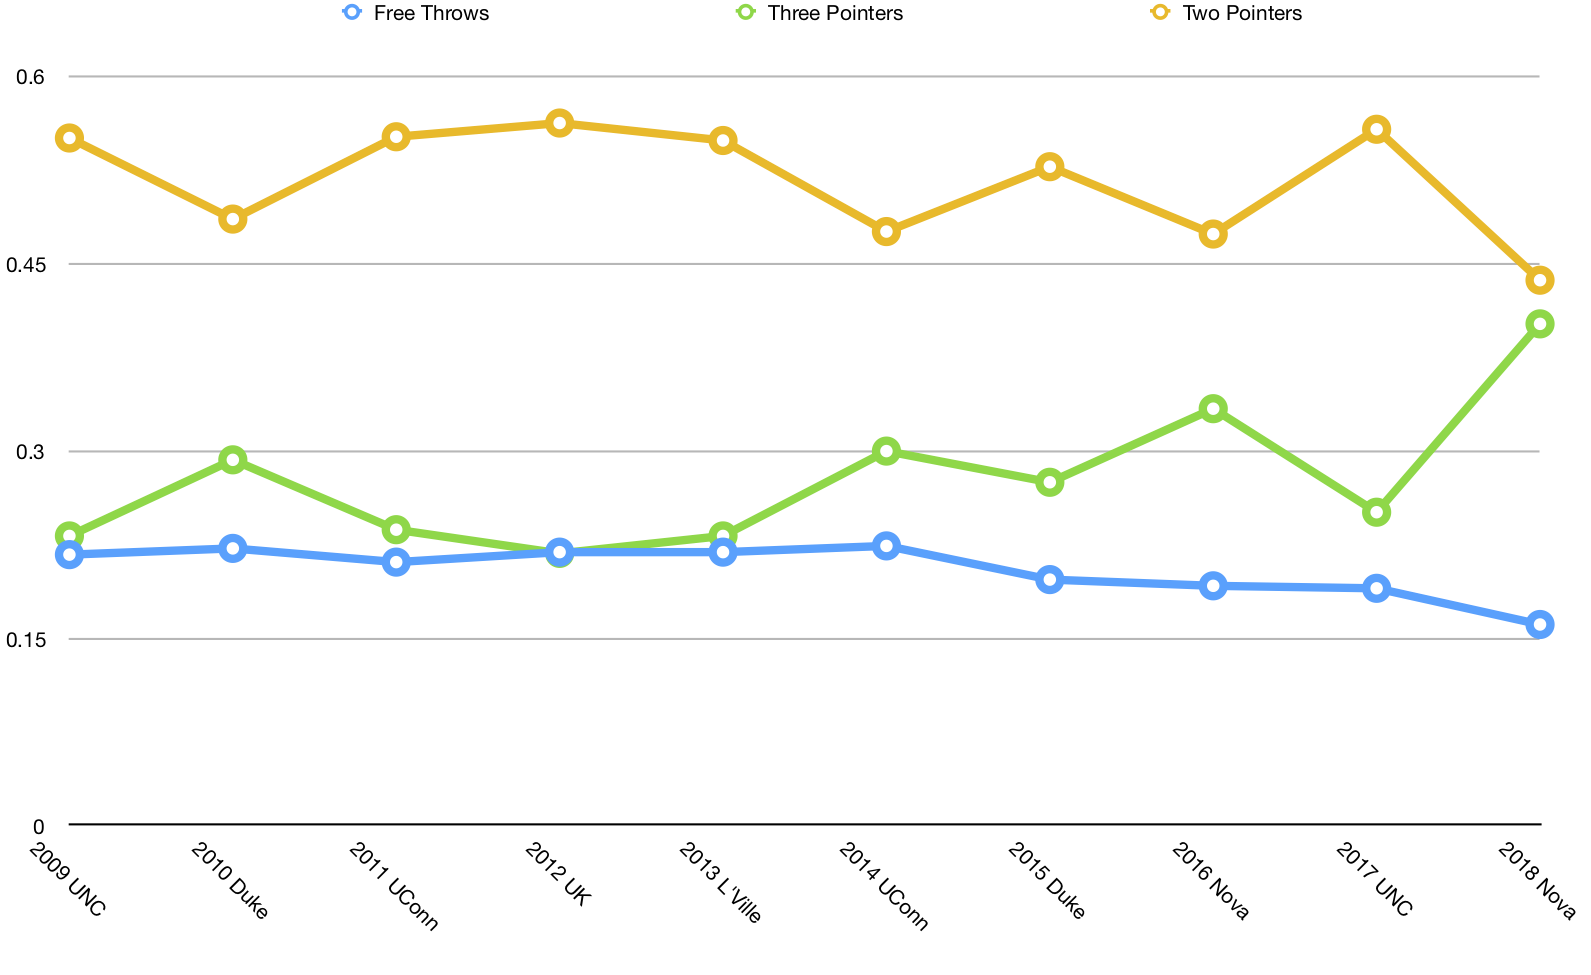
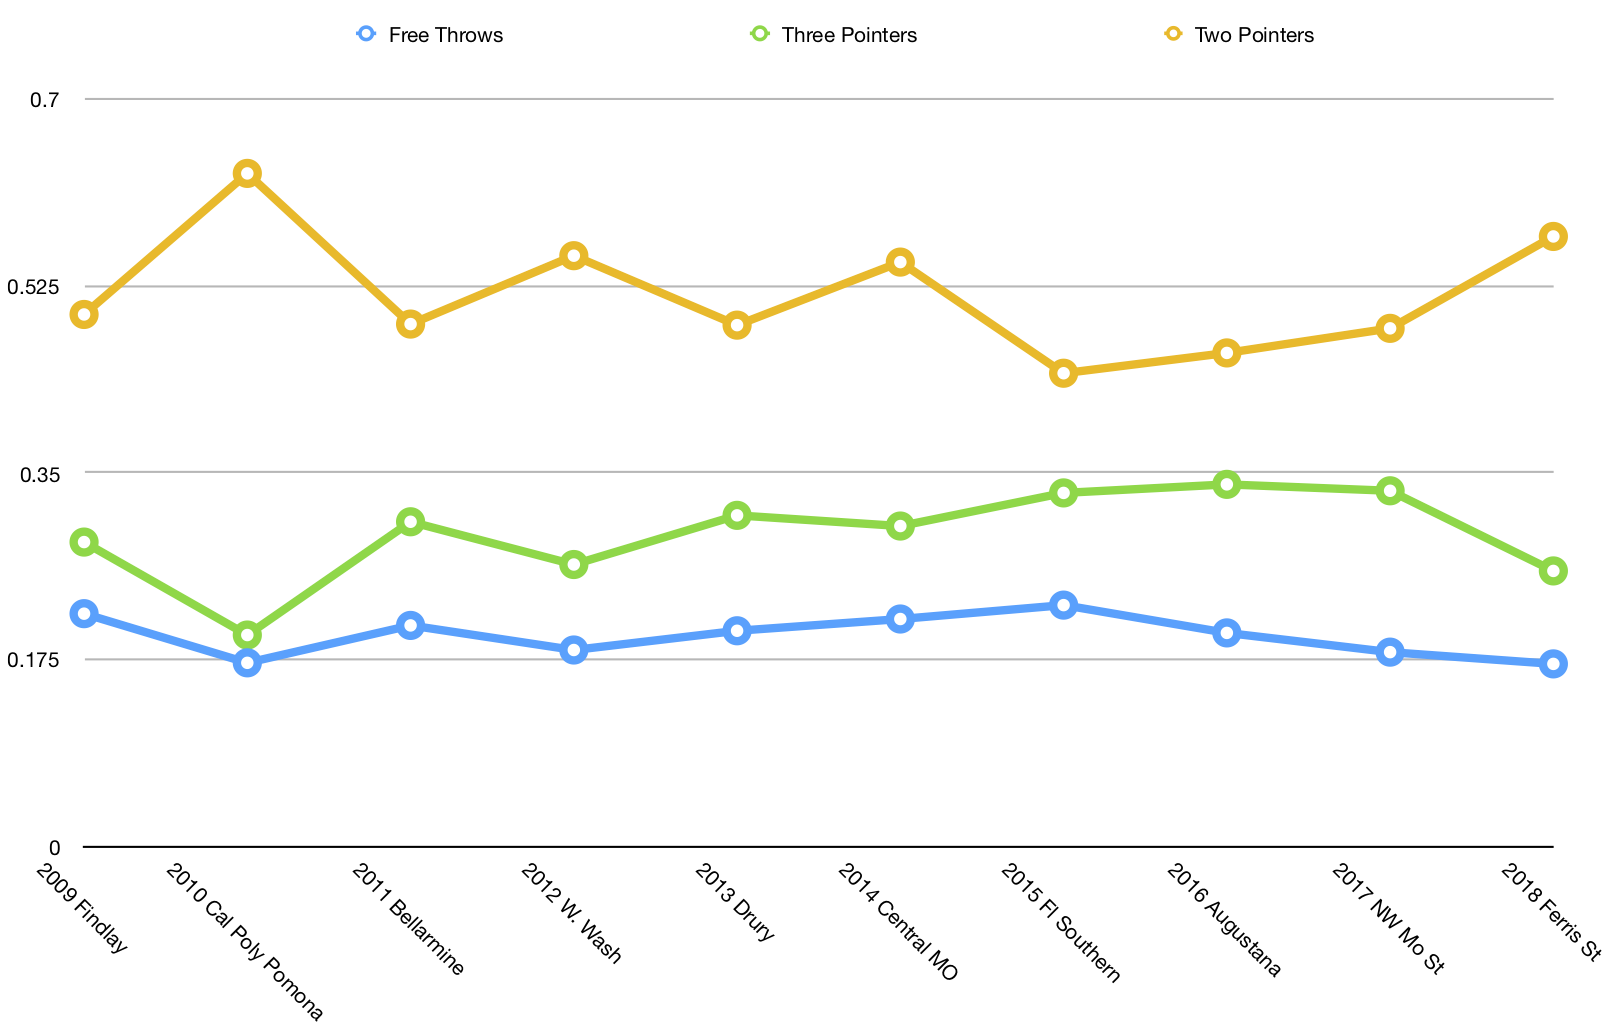
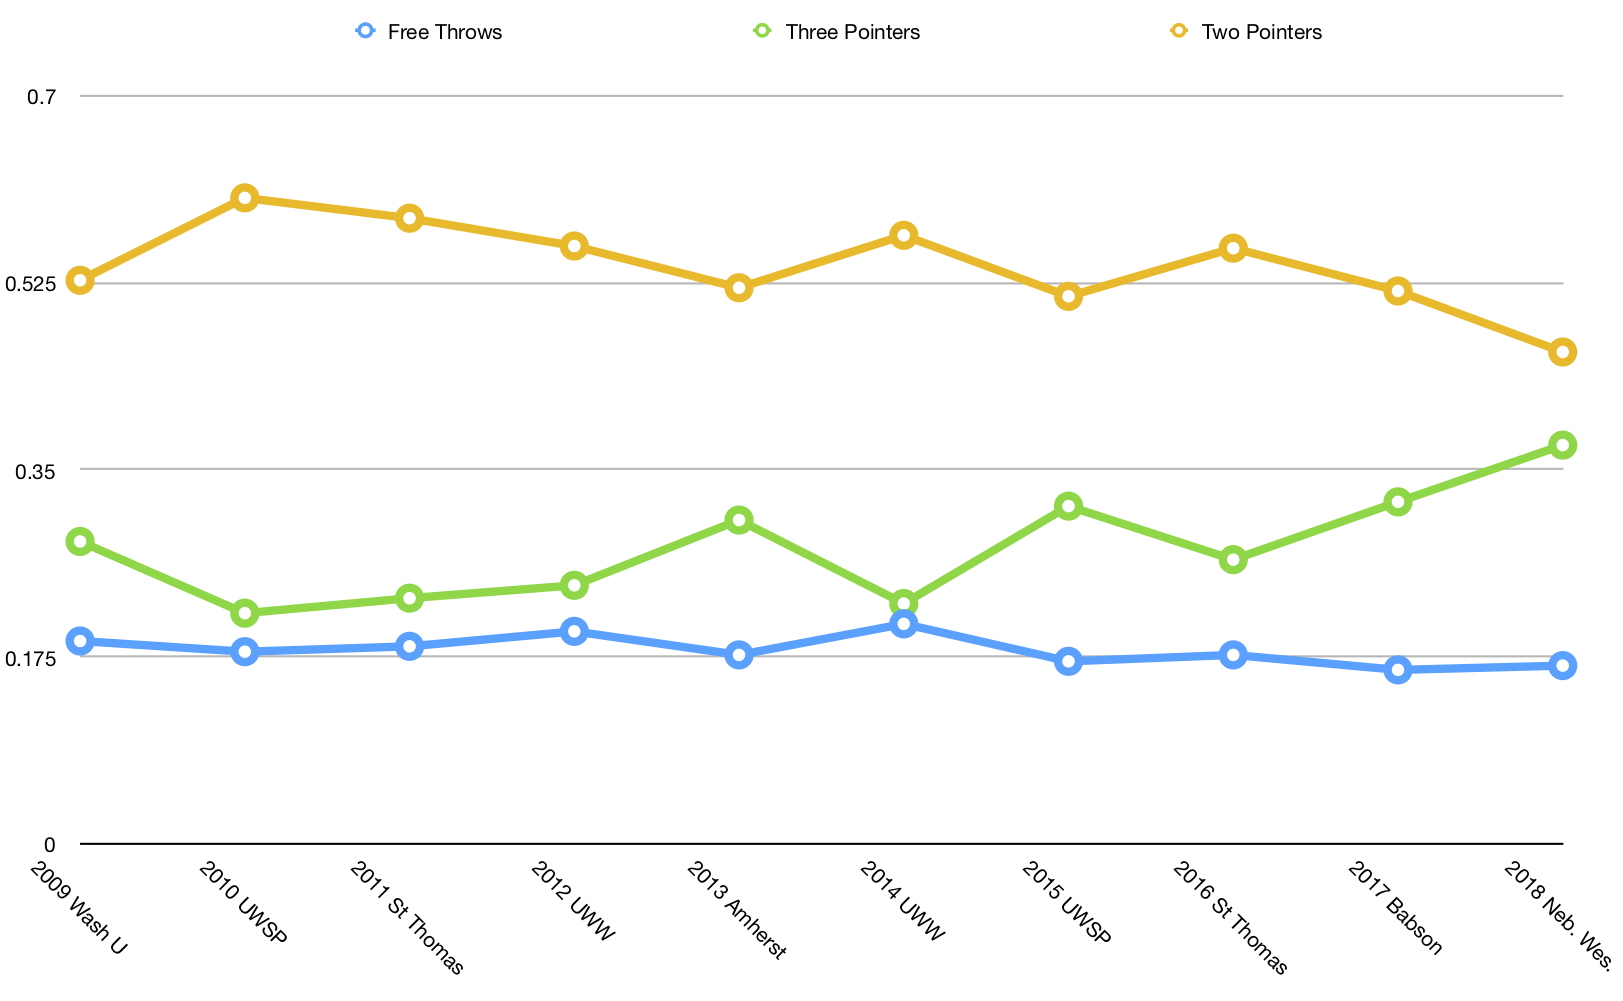
On the women’s side, the two-pointer is more dominant, moreso at the NCAA D1 level than anywhere else. NCAA D3 and NAIA D1 lead the way on three-pointers while NAIA D2 has a slight edge over NCAA D2 on the reliance on free throws.
(Click to enlarge)
Again the trend line here is what’s most interesting. The D1 Women reached a high on three-pointers during UConn’s four-peat when Breanna Stewart was dominant and opened up shots for a lot of great shooters there. We talked in an earlier post how UConn certainly used the three-pointer quite a bit but the stats would indicate the other four champions in the last decade went in a different direction, maybe in an effort to not try to beat the Huskies at their own game. The three-pointer/free throw trend is also more level at the D3 level where we’ve had a number of dominant defensive teams, none moreso than Amherst. Dominant teams often create a lot of turnovers and easy two-pointers hence less reliance on the three.
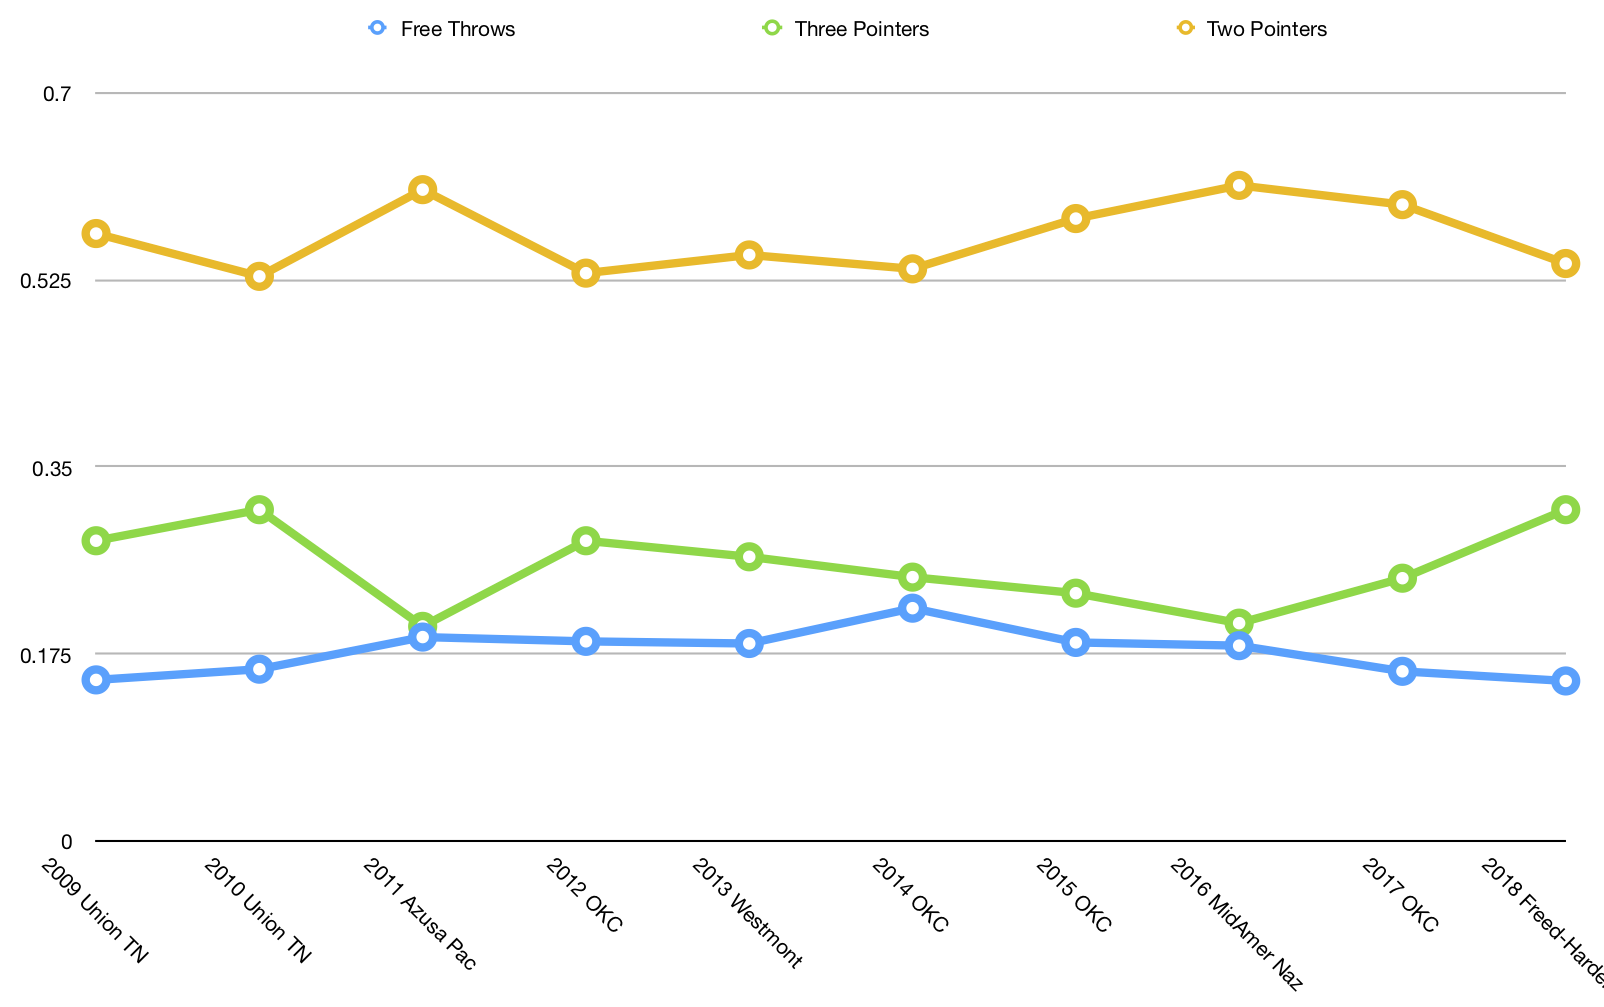
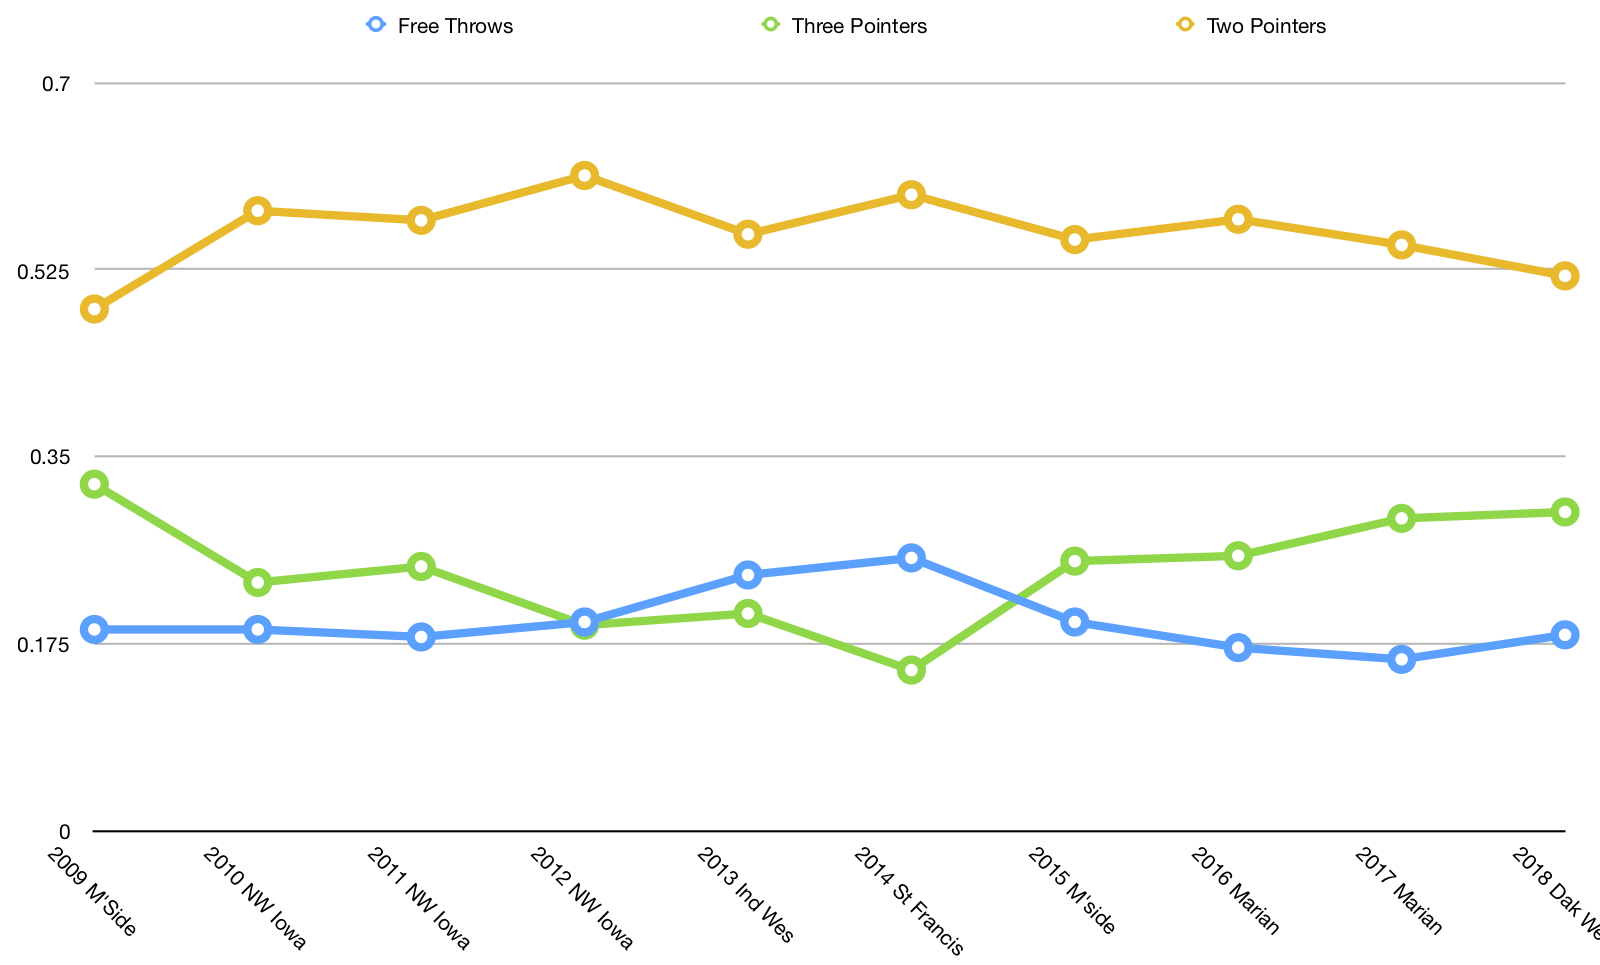
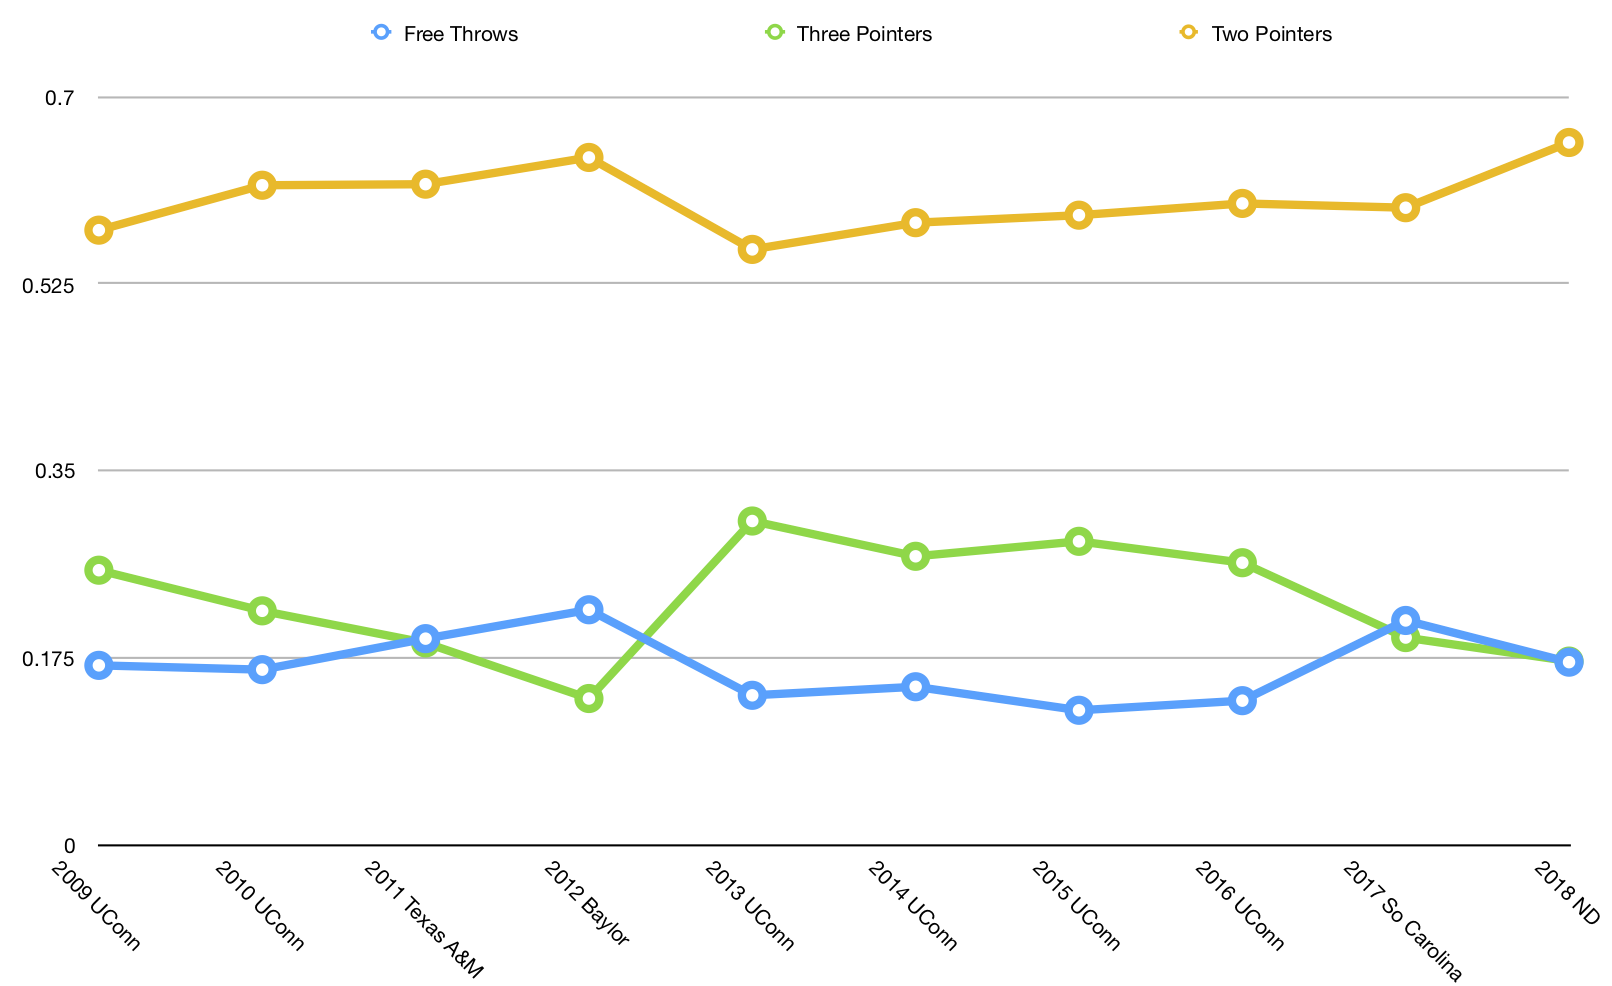

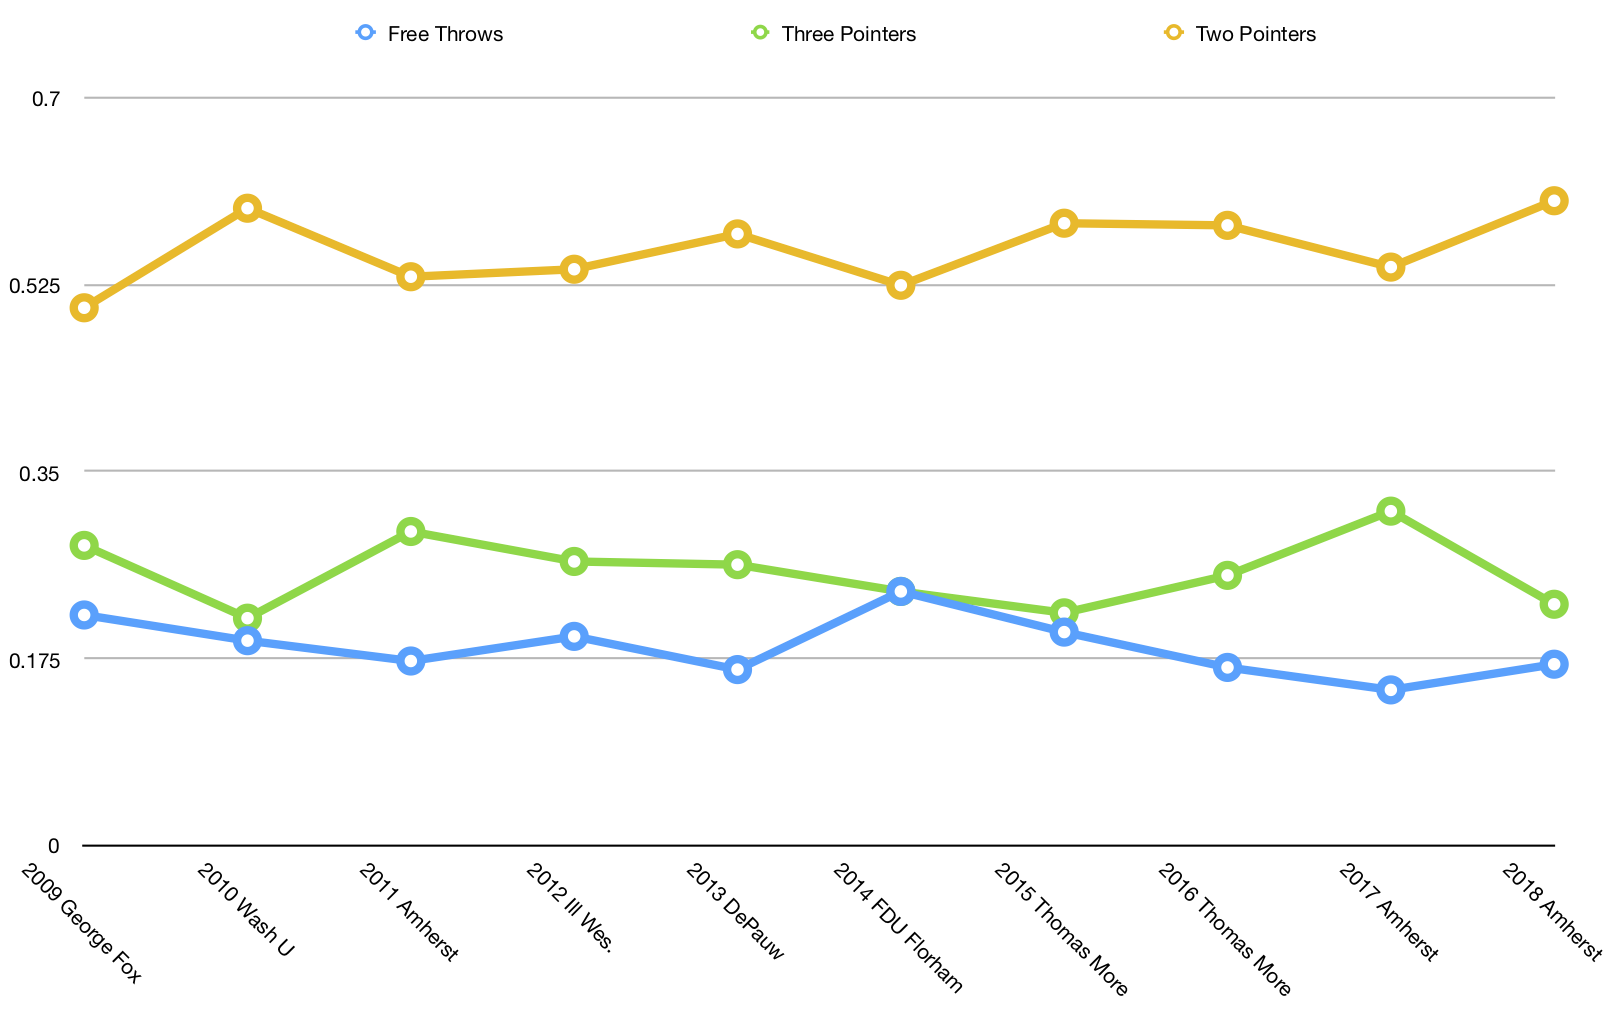
As you can see by some outliers, there’s no hard and fast connection between winning it all and this distribution but it’s certainly interesting to see how you compare.

