Let’s talk about how many points the last ten champs have scored per possession. The whole goal of measuring points in this manner is to do what we math geeks call ‘normalize’ the data. In other words, if one team plays at a really high pace, they will more likely than not score more points than a team that plays at a slower pace. By measuring points per possession, you can compare these two teams regardless of pace of play.
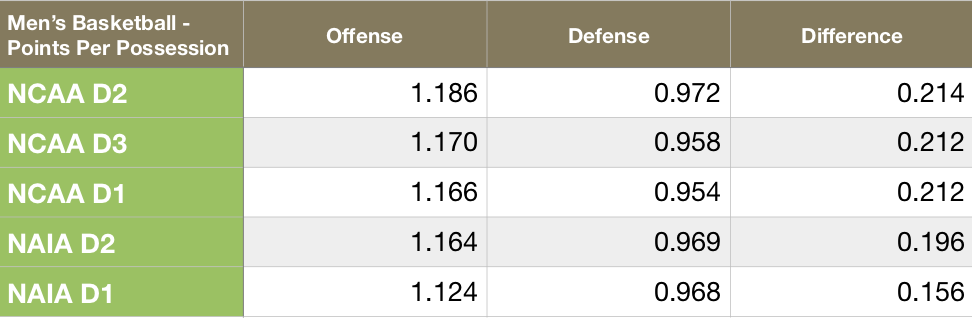
The more significant consideration on both charts is the difference between offensive points per possession and defensive points per possession. That’s how each group is ranked. Consider that across the board, there’s an average of about 70 possessions per game, a difference in this figure of even .2, comes out to a 14 point margin over the course of a game.
Looking at the men’s side, offensively the average at every level was more than 1.16 except at NAIA D1. NCAA D2 led the way with nearly 1.19 points per possession.
 (click to enlarge)
On the women’s side, the D1 women led the way with 1.175 points per possession. The next closest was NAIA D1 at 1.106.
 (click to enlarge)
When looking at your own number, consider that just 1 point per possession leads to an average of 70 points per game. And that’s scoring one two-point basket on just half of those possessions. That would seem to be doable but if you turn it over just 10 times, then you have to shoot 35/60 or nearly 60% to get to that 70 points!
That’s an overly simplified example but it does show you the challenge of getting to just one point per possession. But even if that isn’t there, you want to be on the positive side of the ledger where even a slight edge over your opponent can lead to a big difference over the course of a game.