I get questions all the time about data. A lot of coaches have it but don’t know what it means and don’t know ‘what’s good?’.
So, we decided to look at the players at each level that everyone thinks are good, All-Americans, and see how their numbers shook out.
First a few definitions:
Effective Field Goal Percentage (eFG%) – Formulaically, it’s defined as
(FGM + 0.5*3FGM)/FGA
So, it gives a little more weight to three pointers made because it’s harder shot but since you’re getting more points, a more ‘effective’ shot.
True Shooting Percentage (TS%) – Again starting with the formula:
PTS/(2*(FGA+(0.44*FTA))
This takes a look at all the shots a person attempts during a game including free throws. That’s why this is called ‘Shooting’ while the previous measure is just ‘Field Goal’.
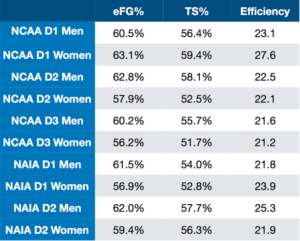
Finally, Player Efficiency is essentially all the good stuff (points, rebounds, assists, steals, blocks) minus all the bad stuff (missed shots, missed free throws, turnovers). Anything in double digits here is good and as you’ll see in the chart below, everything about 20 is great. But it is possible to have a negative number here and while single digits isn’t bad, you’re not winning a title without a couple of players in the teens or higher.
The chart below shows the average effective field goal percentage, true shooting percentage and efficiency numbers for the All-Americans last season at each level (note: these are All-Americans from the WBCA, NABC and NAIA voters).